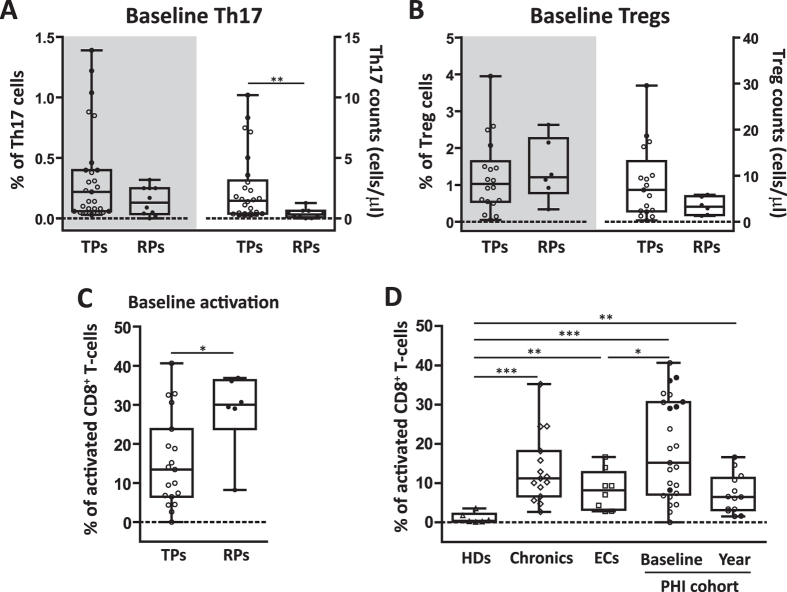
Figure 2. Th17 and Treg subsets among recently HIV-infected individuals that show different patterns of immune activation and disease progression.
Comparison of baseline frequencies (right y axes) and absolute counts (left y axes) of Th17 (A) and Treg (B) cells between typical (TP, white symbols) and rapid (RP, black symbols) progressors. Baseline frequency of CD3+ CD8+ T-cells positive for CD38+ and HLA-DR+ activation markers was determined in TP and RP PHI sub-groups by flow cytometry (C). Frequency of activated CD8+ T-cells was determined for all groups (D). Boxes indicate median values with 25–75 percentiles and bars show the maximum and minimum values. Symbols represent individual patients within each group. The p values obtained are depicted as * p < 0.05, ** p < 0.01 and *** p < 0.001.

