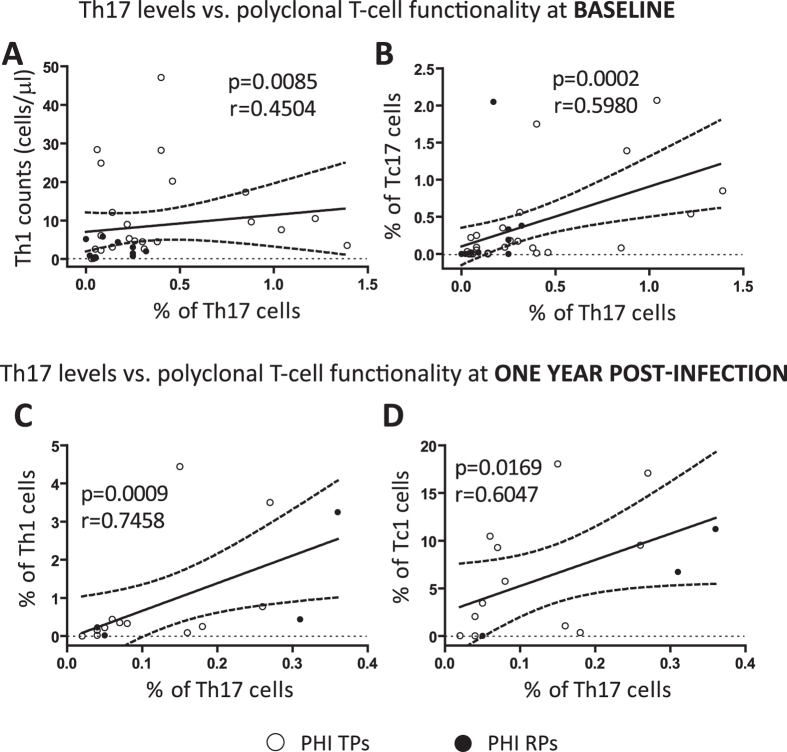
Figure 5. Correlations between the Th17 subset and other T-cell effector sub-populations measured upon polyclonal stimulation.
Positive correlations between Th17 levels and polyclonal T-cell effector subsets found within PHI cohort: % of Th17 cells versus (vs.) Th1 (CD4 + IFN-γ + ) counts (A) and % of Tc17 (CD8 + IL-17 + ) cells (B) both at baseline; % of Th17 cells vs. % of Th1 cells (C) and % of Tc1 (CD8 + IFN-γ + ) cells (D) both at one year p.i. Polyclonal T-cell effector sub-populations were determined by flow cytometry after 6 hours of stimulation with a mixture of anti-CD3/anti-CD28 antibodies as described in Materials and Methods. Symbols distinguish individual patients from the different sub-groups indicated in the figure. PHI: primary HIV infection cohort. TPs: typical progressors. RPs: rapid progressors. All r and p values correspond to Spearman’s correlations.

