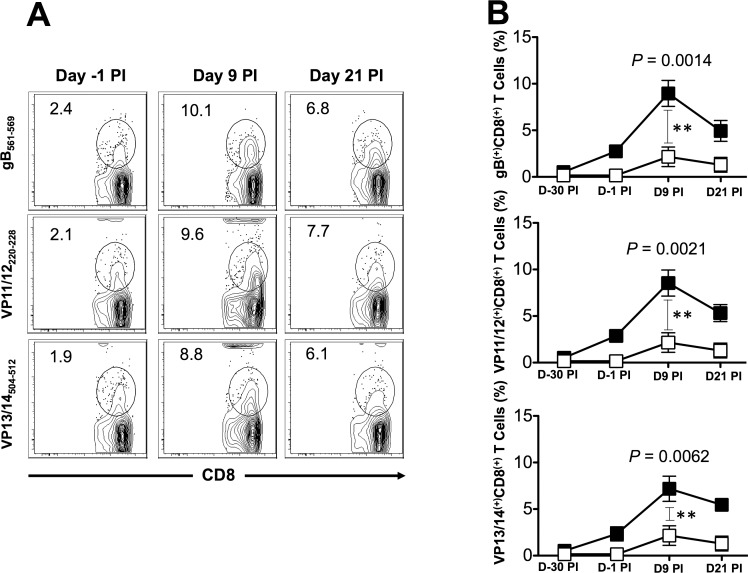
Figure 3.
Frequency of gB-, VP11/12-, and VP13/14-specific CD8+ T cells induced in HLA-Tg rabbits after immunization and virus challenge. We immunized HLA-Tg rabbits twice as shown in Figure 2 with mixtures of ASYMP peptides from gB, VP11/12, or VP13/14 antigens and bled 15 days after the second immunization (i.e., 1 day before challenge). Animals were ocularly challenged with HSV-1 and bled on days 9 and 21 after challenge as shown in Figure 2 above. Blood from mock-immunized rabbits that received adjuvant alone was used as a negative control. We isolated PBMCs from blood at the indicated time points and the frequency of HSV-1 epitope-specific CD8+ T cells was determined specific to each of the three immunizing CD8+ T-cell epitopes using the corresponding HLA-A2-peptide/Tetramer. (A) Representative contour plot of tetramer CD8+ T cells specific to gB561–569, VP11/12220–228, and VP13/14504–512 epitopes in PBMCs from immunized rabbits. The numbers at the top of each box represents the percentages of epitopes-specific CD8+ T cells. (B) Average frequency of tetramer specific CD8+ T cells. Solid squares represent immunized rabbits. Open squares represent mock-immunized rabbits. The results are representative of 2 independent experiments. The indicated P values, calculated using the ANOVA test, show statistical significance between peptide immunized and mock-immunized rabbits on day 9 after infection.

