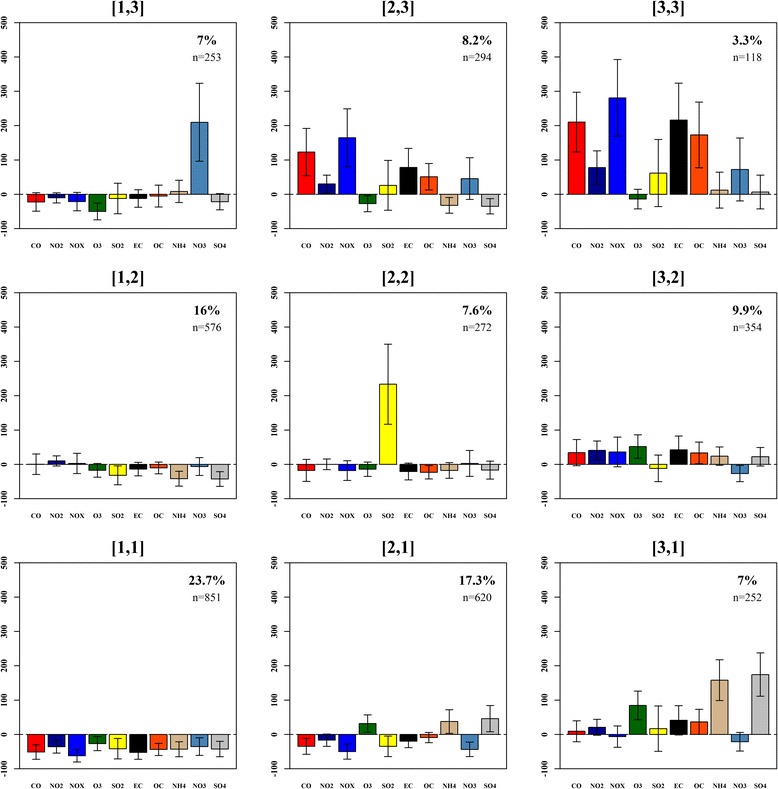
Fig. 2.

A 3 × 3 SOM of 9 multipollutant day types observed in Atlanta, GA, from January 1, 1999 to December 31, 2008. For each type, profile bars reflect the average (±SD) pollutant concentrations on assigned days zeroed to the overall mean on a percentage scale. Coordinate labels are in brackets [] and the relative frequencies (%) and within-class sample size (n) are presented in the upper right hand corner of each panel
