
Fig. 3.
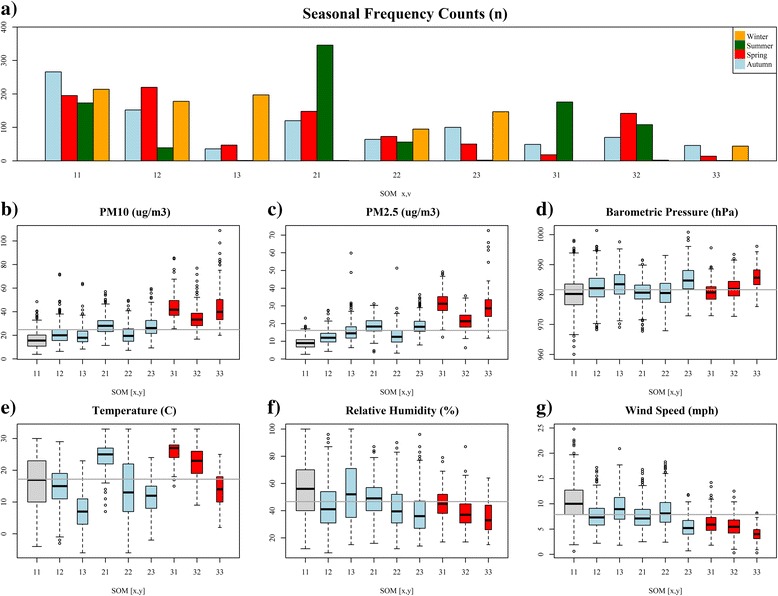
Seasonal frequencies, particulate matter, and meteorological summaries for the 9 multipollutant day types identified in Atlanta, GA, from January 1, 1999 to December 31, 2008. Panel a provides the seasonal frequency counts for each type. Panels b-g provide boxplots illustrating the distribution of particulate matter and meteorology under each category. Grey indicates our referent level; Light blue indicates insignificant day types; Red indicates day types significantly associated with asthma