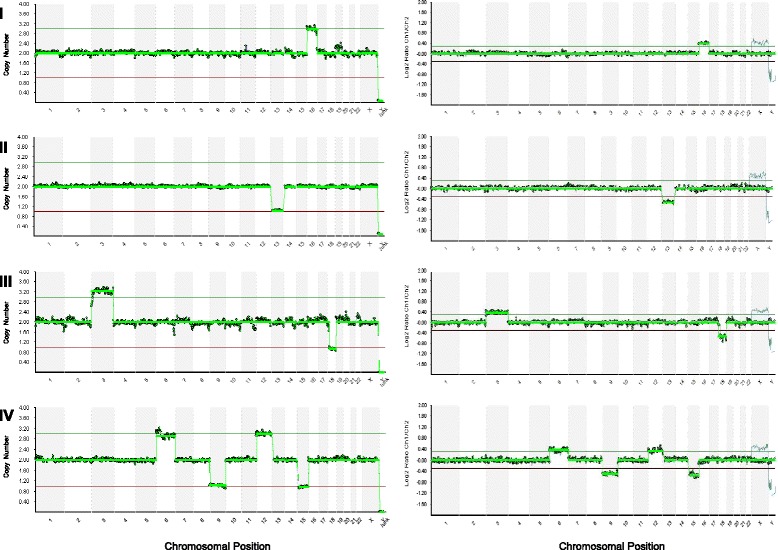
Fig. 1.

Representative profiles showing different types of aneuploidies detected by NGS (the left panel) and aCGH (the right panel) screening of the same whole genomic amplification (WGA) products. Each NGS profile in the left panel indicates the chromosome numbers on the x-axis and copy numbers of chromosomes on the y-axis. Each aCGH profile in the right panal indicates the chromosome numbers on the x-axis and log ratio of chromosomes on the y-axis. I. Aneuploid profile with single chromosomal gain (trisomy): a gain of chromosome 16; II. Aneuploid profile with single chromosomal loss (monosomy): a loss of chromosome 13; III. Aneuploid profile with dual chromosomal abnormalities: a gain of chromosomes 3 and a loss of 18; IV. Aneuploid profile with complex chromosomal abnormalities: gains of chromosomes 6 and 12 and losses of chromosomes 9 and 15
