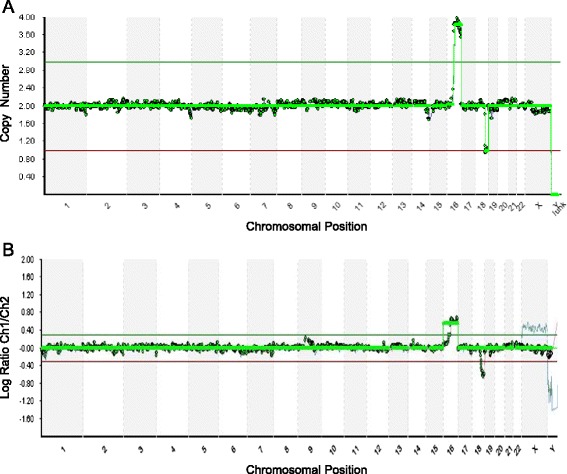
Fig. 2.

Representative profiles showing segmental imbalances detected by NGS (the upper profile) and aCGH (the lower profile) screening of the same WGA product. The upper profile (a) was resulted from NGS screening which revealed a 42 Mb gain on the q arm of chromosome 16 and a 16 Mb loss on the q arm of chromosome 18 more precisely compared to aCGH screening in the lower profile (b)
