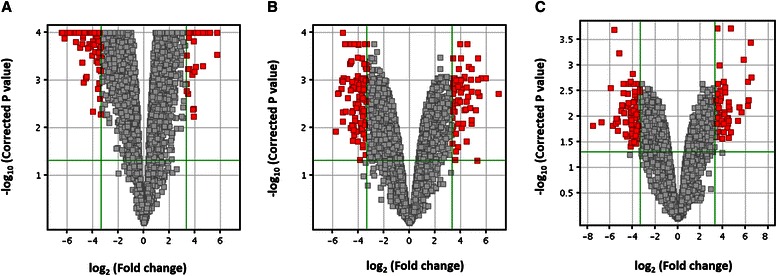
Fig. 2.

Volcano plots. The distribution of the gene expression fold changes and corrected p-values in each subgroup a Luminal A, b Luminal B, and c Triple negative compared with normal controls were shown. A total number of 4569 genes with p-value < 0.05 were used for the analysis. Genes with absolute fold change ≥ 10 and p-value < 0.05 are indicated in red. Plots are generated using Gene Spring 12.6 with moderated t-test and Benjamini-Hochberg testing correction
