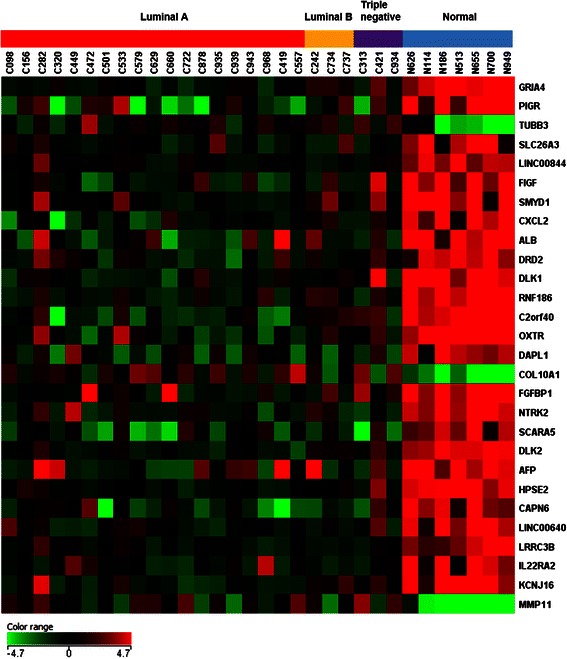
Fig. 3.

Heat map. The expression patterns of 28 genes out of 50,739 biological probes after one-way ANOVA test with a corrected p-value < 0.05 and fold change ≥ 10 in all three breast cancer subtypes were shown in the heat map using Gene Spring 12.6 software. The heat map indicates up-regulation (red), down-regulation (green), and mean gene expression (black). The columns represent individual tissue samples covering 3 breast cancer subtypes: Luminal A (red), Luminal B (yellow), and Triple negative (purple) as well as normal samples (blue). The rows are labeled with individual gene symbols
