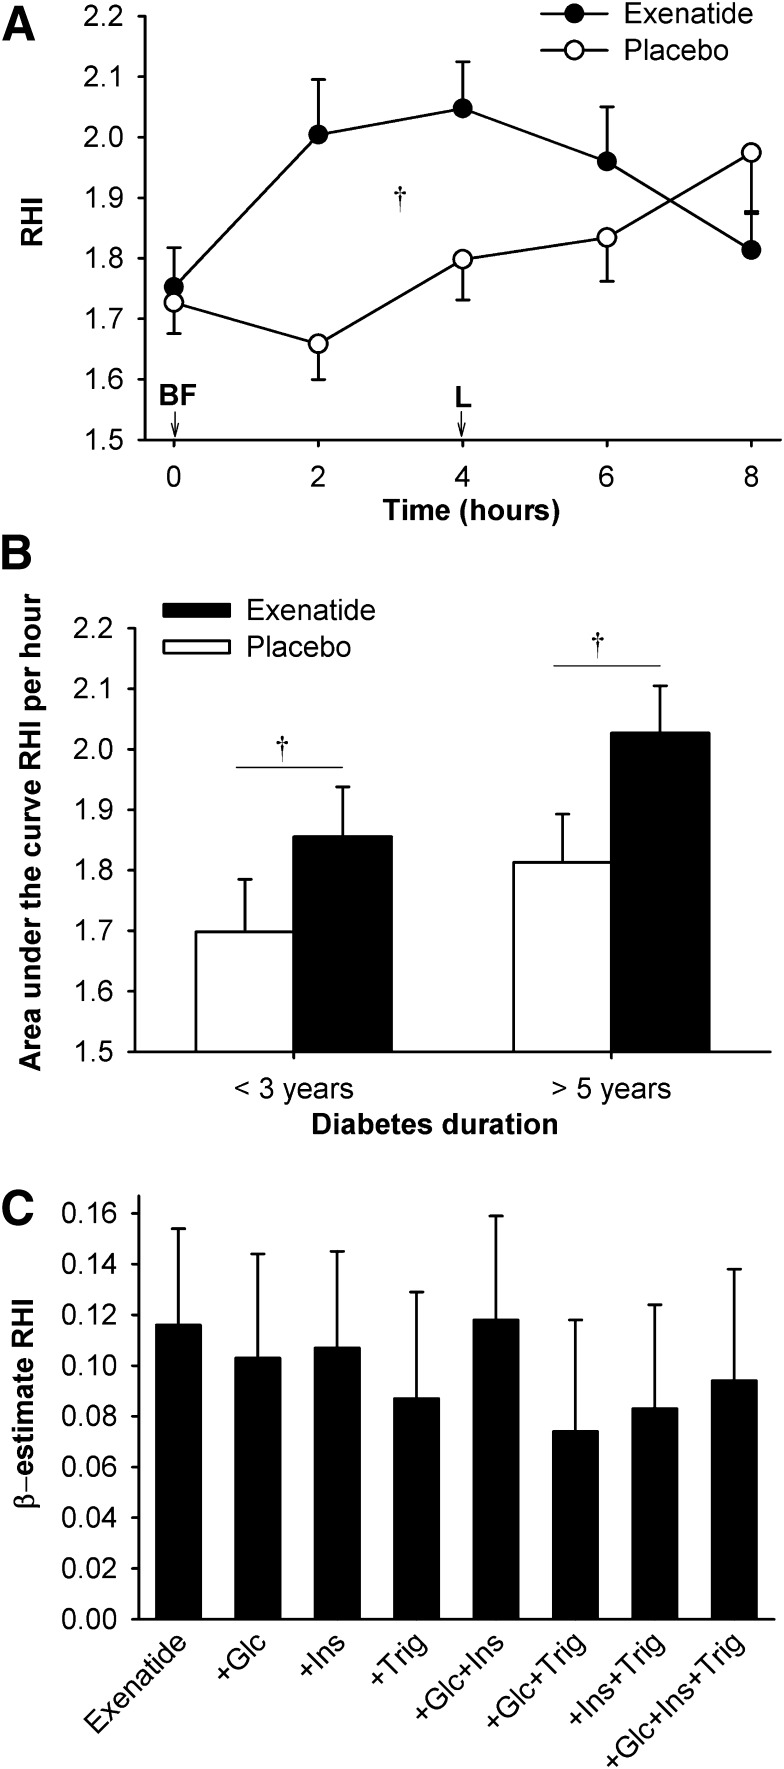
Figure 3.
The effect of exenatide on EF (RHI) in study 1. RHI was calculated as the ratio of the average amplitude of the PAT signal over a 30 s time interval starting 90 s after blood pressure cuff deflation divided by the average amplitude of the PAT signal of a 3.5-min time period before cuff inflation. On day 11 of therapy, immediately after initial blood sampling (time 0), study drug was injected and participants ingested a breakfast meal (BF) and 4 h later a lunch meal (L). A: RHI over the 8-h test period. B: RHI area under the curve (normalized to 1 h, by trapezoid method) according to the duration of diabetes. Data are means ± SE. †P < 0.05, exenatide vs. placebo. C: Multivariate models of exenatide’s effect on RHI. The modeled effect is shown as β estimates and SE of exenatide’s effect on RHI before and after adjustment for plasma glucose (Glc), insulin (Ins), and triglyceride (Trig) concentrations. Adjustments for individual or combinations of these variables did not significantly reduce the effect of exenatide.

