Figure 4.

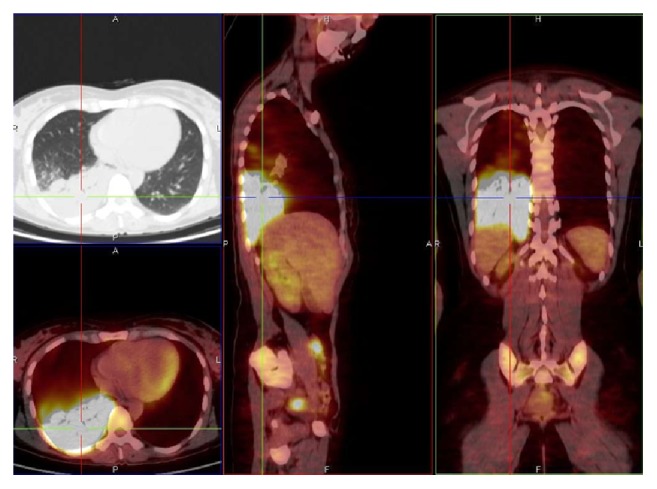
M. tuberculosis infection. Massive area of high metabolic activity, SUV max 19.55, lower right lobe. Related to patient 11 (PET/CT. Courtesy “V. Monaldi” Hospital).

M. tuberculosis infection. Massive area of high metabolic activity, SUV max 19.55, lower right lobe. Related to patient 11 (PET/CT. Courtesy “V. Monaldi” Hospital).