
Fig. 2.
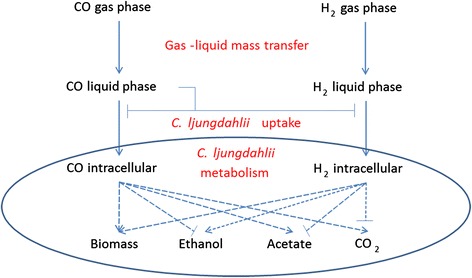
The effects of CO and H2 mass transfer and cellular uptake on biomass production and the distribution of metabolic products by C. ljungdahlii. The lines with arrows represent positive/activating effects and the lines with bars represent negative/inhibitory effects