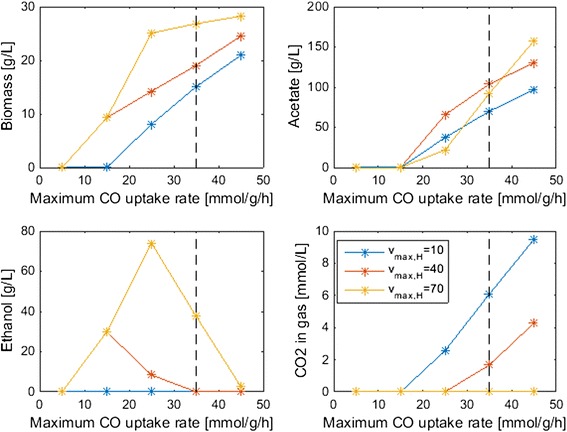
Fig. 7.

Effect of the CO and H2 maximum uptake rate parameters on steady-state biomass and byproduct concentrations at the top column. The dashed lines indicate the nominal CO maximum uptake rate used in the other simulations. The nominal H2 maximum uptake rate was v max, H = 70 mmol/gDW/h
