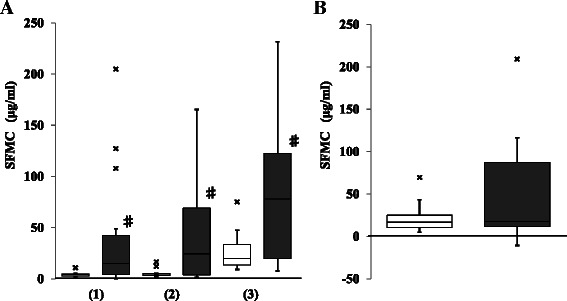
Fig. 4.

Comparison of soluble fibrin monomer complex (SFMC) between the groups. a: SFMC at the start of cardiopulmonary bypass (CPB) (1), at 1 h from the start of CPB (2), and at the end of CPB (3). b: The increase in SFMC during CPB. □ (open column): valve surgery; ■ (closed column): aortic replacement surgery; x: outlier; Data are showed as box and whisker plots (25 and 75 percentiles, outliers). Outliers are showed as cases with values more than 1.5 times of box lengths from either end of the box. #: p < 0.05. No significant difference in the increase in SFMC during CPB was detected between the groups
