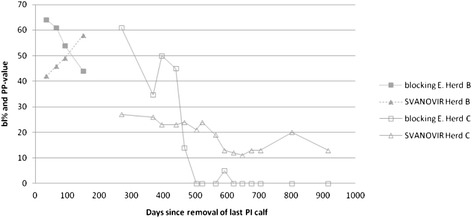
Fig. 4.

Change in bulk milk values after removal of all PI calves (herds B and C). Results from two dairy herds during a 149 days evaluation for herd B and 915 days for herd C. The y-axis represents the bl% and PP-values according to the blocking ELISA and the SVANOVIR respectively, while the x-axis represents the number of days since removal of the last born PI calf and the bulk milk sampling. Four and fifteen samples were tested from herds B and C respectively
