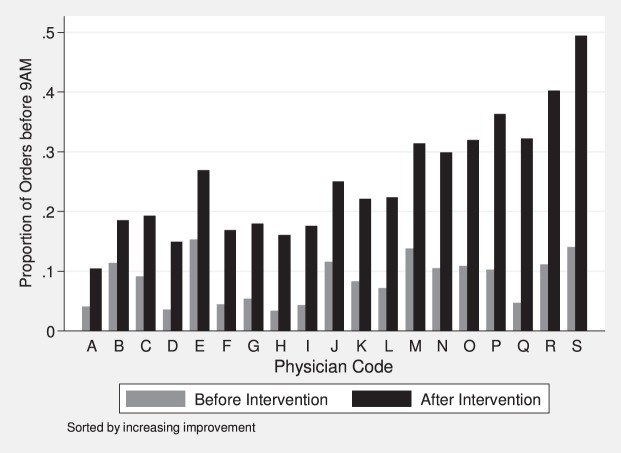
FIGURE 3.
Timely Discharge Orders by Attending Hospitalists in Intervention Groupa
a More than 25 discharges before the intervention and 25 discharges after the intervention (total N = 5210 discharges for 19 hospitalists, mean = 274, range = 139–453). All differences were significant (P < .05), except physician B (P = .13).

