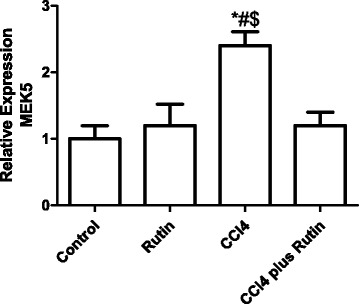
Fig. 2.

The Effect of CCl4, rutin, and their combination on the expression levels of MEK5 gene in rat liver. Data were presented as mean ± SEM (n = 10). *, # and $ indicate significant change from control, rutin and CCl4 plus rutin, respectively, at P < 0.05 using ANOVA followed by Tukey–Kramer as a post ANOVA test
