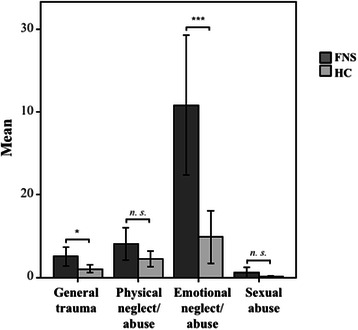
Fig. 1.

Adverse Childhood Experiences. Bar graph illustrating the sum scores (events x frequency) per ETI domain (general traumata, physical neglect/abuse, emotional neglect/abuse, sexual abuse) and group (FNS, HC). Asterisks indicate significance of * p ≤ 0.05, ** p < 0.01, *** p < 0.001
