
Figure 3.
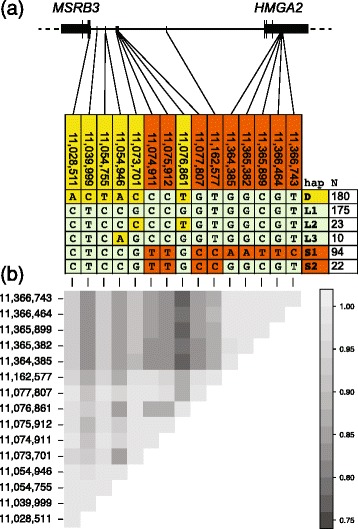
Haplotype structure inferred across 15 SNPs highly associated with ear type or body mass and patterns of linkage disequilibrium. a Locations of SNPs on the haplotype relative to the MSRB3 and HMGA2 genes. SNPs and haplotypes associated with ear type are highlighted yellow whereas those associated only with body mass are highlighted orange. Only haplotypes present >7 times in the dataset are shown. b Pairwise estimates of linkage disequilibrium measured by |D’|