
Fig. 3.
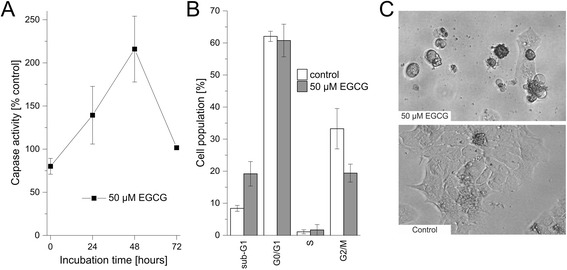
Effect of EGCG on caspase activity and cell cycle in TFK-1 cells. a Time-dependent effect of 50 μM EGCG on caspase activity in TFK-1 cells. For each time point, values are related to untreated control. b Cell cycle distribution of TFK-1 cells after 72 h. Sub-G1 represents cells with a DNA content less than 2 N, G0/G1 cells with DNA content 2 N, S cells with DNA content greater than 2 N and G2/M cells with DNA content 4 N. c Representative microscopic pictures of EGCG-treated and untreated TFK-1 cells, showing cell shrinkage, rounding and apoptotic bodies, respectively. Abbreviations: EGCG: Epigallocatechin gallate