Figure 4.
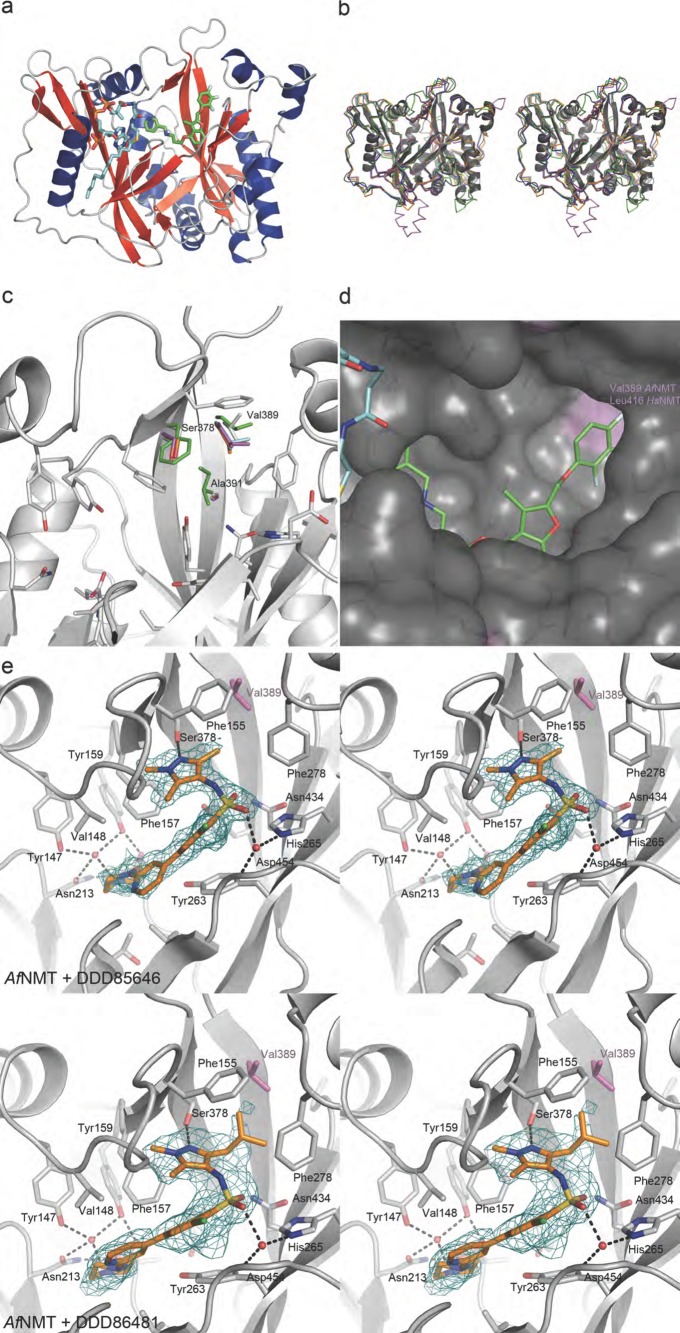
Crystal structure of AfNMT complexes with inhibitors. (A) Overall fold of AfNMT (residues 86–492) in complex with MCoA (stick representation, Cα cyan) and RO-09-4879 (stick representation, Cα green). (B) Representative crystal structures of NMTs. AfNMT shown in gray cartoon superimposed upon ScNMT (PDB 1IIC, green), LmNMT (PDB 3H5Z, magenta), HsNMT1 (PDB 3IU1, cyan), and PvNMT (PDB 4B10, orange). (C) Conservation of NMT active site residues. AfNMT backbone shown in gray cartoon with active site side chains shown in stick representation (C atoms gray). Strictly conserved residues between species are shown for AfNMT only. Where residues are not conserved, they are shown for all species in stick representation, ScNMT (green), LmNMT (magenta), HsNMT1 (cyan), and PvNMT (orange). (D) Close-up view of the AfNMT active site, showing the MCoA (Cα cyan) and RO-09-4879 (Cα green). A molecular surface is shown, colored by sequence conservation with HsNMT1 (gray, identical side chains; purple, nonidentical side chains). (E) Stereoscopic view of the active site of the AfNMT in complex with DDD85646 and DDD86481. Active site side chains are shown as sticks with gray Cα, whereas the compound is shown as sticks with gold Cα. The unbiased |Fo| – |Fc| map (2.5 σ) is shown as a green mesh.

