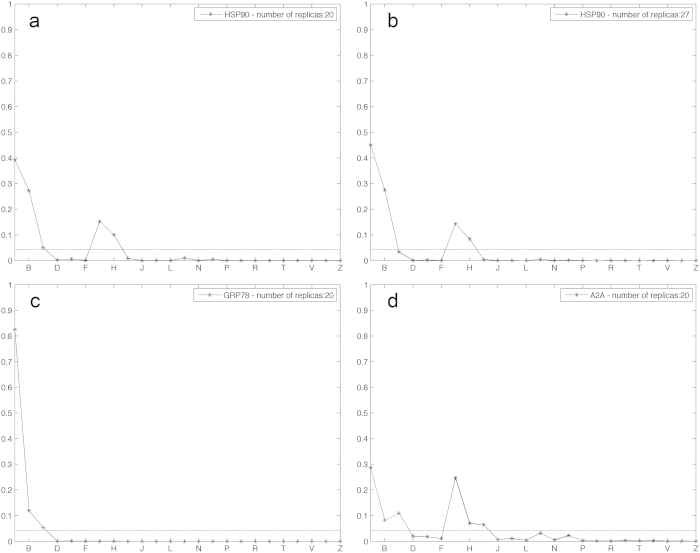
Figure 3. Ranking probability estimates obtained via the bootstrap procedure.
Ranking probability estimates are presented for the three systems. In the abscissae, all the 24 possible rankings have been coded with an alphabet letter (Table 2), where the first, ‘A’, position corresponds to the experimentally validated ranking. The horizontal dashed lines correspond to 1/24, i.e. the probability or randomly drawing one out of the 24 possible rankings. a) HSP90 ranking probabilities with 20 replicas. b) HSP90 ranking probabilities with 27 replicas. c) Grp78 ranking probabilities with 20 replicas. d) A2A ranking probabilities with 20 replicas. As expected, increasing the number of replicas, as done for the HSP90 case, corresponded to an increment of the probability of the ‘A’ ranking at the expense of its competitors ‘B’,’G’, and ‘H’. Data for different values of number of replicas are shown in the Supplementary movies 1, 2 and 3 for HSP90, GRP78 and A2A, respectively.

