Fig. 4.
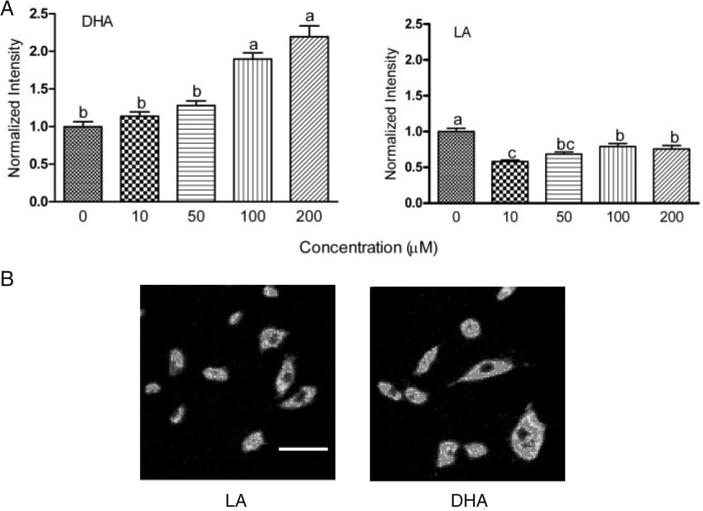
Fatty acids selectively alter mitochondria membrane potential. (A) YAMC cultures were treated with DHA or LA at 0, 10, 50, 100 and 200 μM for 72 h. To measure the changes in the basal level of MP following fatty acid treatment, cells (post-treatment) were loaded with Rhodamine 123. Each treatment group contained from 107 to 221 cells from two independent experiments. All data were divided by the average fluorescence intensity of the control. Values not sharing the same letters are significantly different (P < 0.05). (B) Representative photomicrographs (400×) of cells incubated with 50 μM DHA or LA for 72 h. DHA enriched cells demonstrated a higher fluorescence intensity as compared with LA. Scale bar, 60 μm in all images. See online Supplementary material for a color version of this figure.

