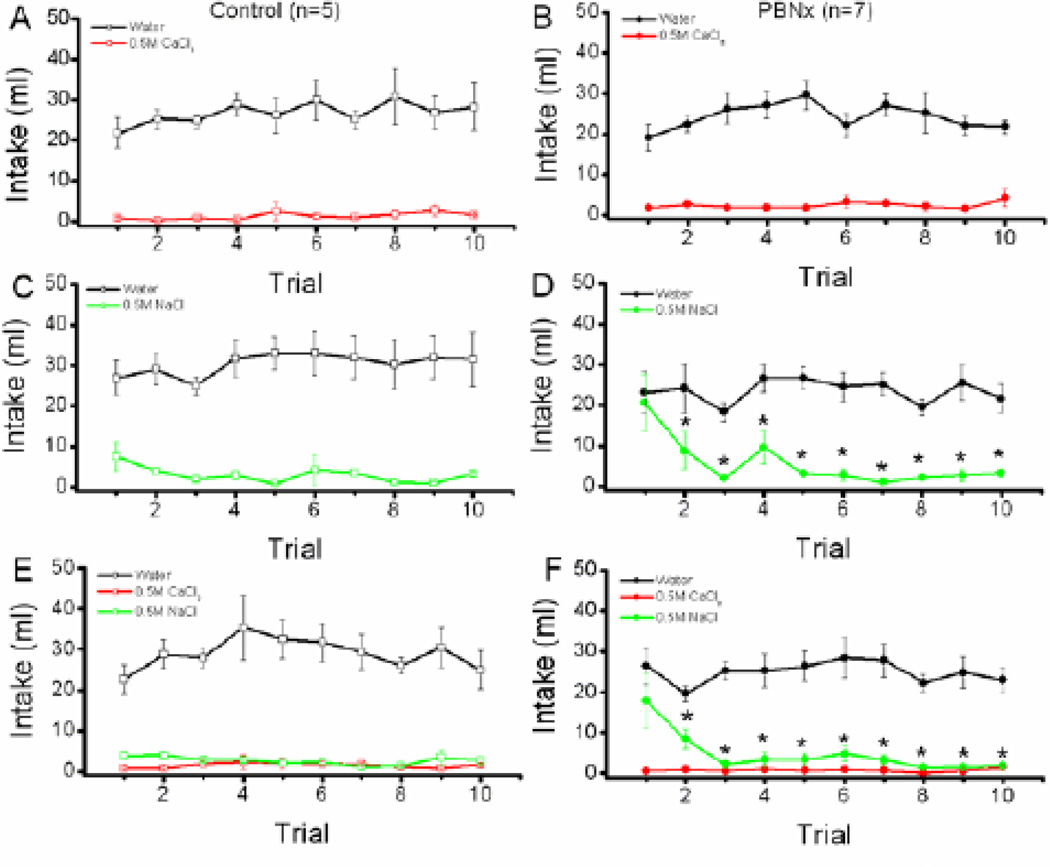
Figure 2.
Baseline CaCl2 intake. Top panels: Intake (ml/24h) of water and 0.5 M CaCl2 by Control (A) and PBNx (B) rats in the Water-CaCl2 (WC) condition across 10 days of baseline. Middle panels: Intake (ml/24h) of water and 0.5 M NaCl by Control (C) and PBNx (D) rats in the water-NaCl (WN) condition across 10 days of baseline. Bottom panels: Intake (ml/24h) of water, 0.5 M CaCl2, and 0.5 M NaCl by Control (E) and PBNx (F) rats in the water-CaCl2-NaCl (WCN) condition across 10 days of baseline. * indicates that NaCl intake on Trial 1 differs significantly from intake of NaCl on Trials 2 – 10, ps < 0.05.

