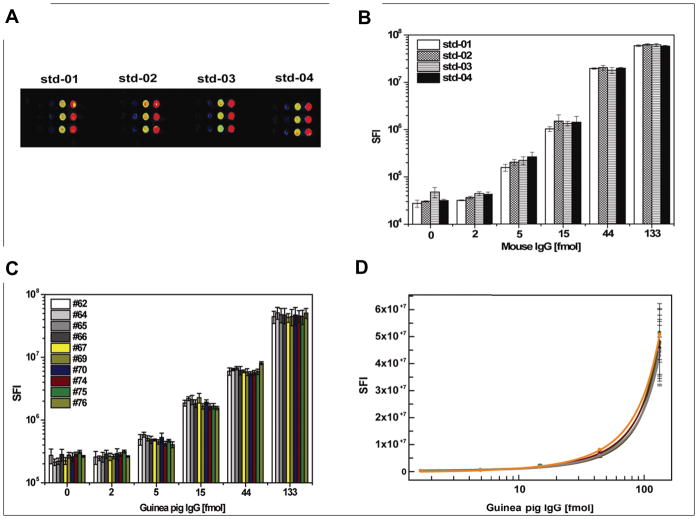
Figure 2. Influence of zone effect and serum on the IgG standards.
(A) is the fluorescent image of mouse IgG standards at different locations of the slide; (B) is the comparison of fluorescent signal intensity of four IgG standards; (C) and (D) are the comparisons of the signal intensity and calibration curve of guinea pig IgG standard after incubation with the serum of ten guinea pigs individually. The detection was performed with DyLight549 conjugated rabbit anti-mouse IgG antibody and rabbit anti-guinea pig IgG secondary antibody, respectively.

