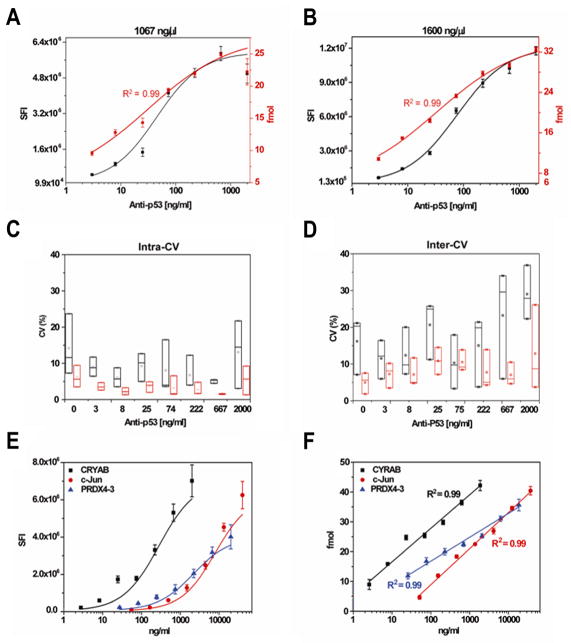
Figure 3. Comparison of the performance of antibody assays without and with MiNC.
(A) and (B) are the detection of anti-p53 antibody using p53 DNA plasmid concentrations of 1067 and 1600 ng/μl used to produce p53 protein locally. The value of y-axis at both sides of x-axis is the signal intensity (black) and the fmol (red) from the blank controls, respectively. (C) and (D) are the comparison of intra-CV and inter-CV using raw signal intensity (black) and MiNC-calibrated intensity (red), respectively. Each boxplot represents the distribution of CV values across three p53 plasmids concentrations (711, 1067, and 1600 ng/μl) in which the bottom edge, top edge, and middle line correspond to the minimum, maximum and median values, respectively. (E) and (F) are the multiplex detection of antibodies in human serum without and with MiNC. The graphs were drawn using raw signal intensity (E) and MiNC-calibrated intensity (F). The error bars represent the standard deviations. The R2 was calculated to show the linear relationship of antibody concentration to calibrated antibody levels using MiNC.

