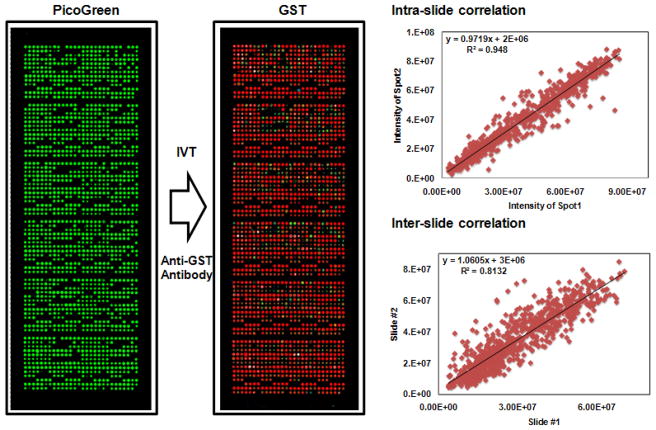
Figure 4. Quality control of NAPPA microarrays with 849 TB genes.
Expression clones encoding the target proteins fused to a C-terminal GST tag were printed along with a polyclonal anti-GST antibody in duplicate on the array surface. DNA capture was confirmed by PicoGreen (PG) staining (DNA, left), in situ protein expression and capture were assessed by GST detection using a monoclonal antibody (protein, middle). The correlation of duplicate spots in one slide (upper right) and between two different slides (lower right) is 0.96 and 0.81, respectively (GST color code: red>orange>yellow>green>blue).

