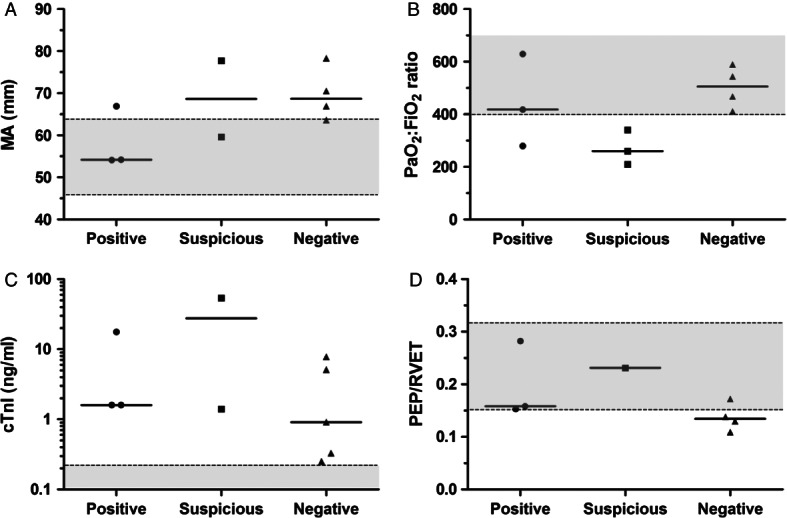
FIG 2.

Scatterplots of clinicopathologic and cardiopulmonary parameters stratified by CT pulmonary angiography (CTPA) diagnosis including (A) Kaolin-activation thromboelastography maximum amplitude; (B) PaO2:FiO2 ratio from arterial blood gas analyses; (C) cardiac troponin I values and (D) pre-ejection period/right ventricular ejection time (PEP/RVET) values. Solid horizontal lines represent the median value. Grey shaded areas between dotted lines represent normal reference intervals
