
Figure 6.
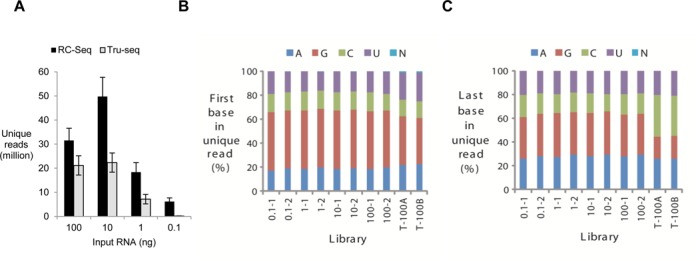
Evaluating the sensitivity and accuracy of RC-Seq. (A) Generation of unique reads by RC-Seq and Tru-Seq as a function of varying input quantities of a synthetic 40 base RNA substrate (5′-phos-NNNNNNNNNNUGAGGUAGUAGGUUGUAUAGNNNNNNNNNN-3′). Tru-Seq libraries were prepared with Illumina Tru-Seq small RNA preparation kit. The PCR cycles were the same for RC-Seq and Tru-Seq with the same amount of starting RNA. (B) Histogram representing the profile of the base (A, C, G or U) at the 5′-end of unique reads. (C) Histogram representing the profile of the base at the 3′-end of unique reads. T-100A and T-100B stand for two replicate data generated from 100 ng of RNA input using Tru-Seq small RNA preparation kit.