
Figure 1.
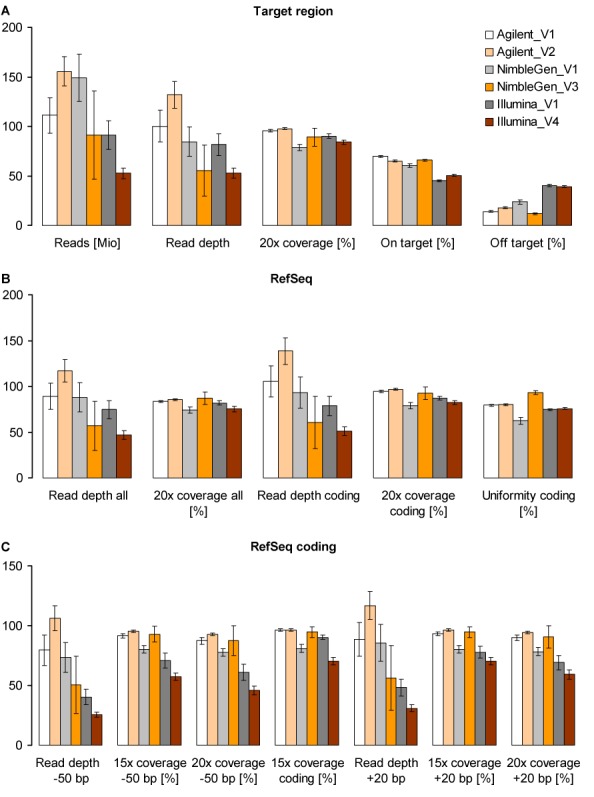
Enrichment efficiency of the three updated exome enrichment platforms (Agilent, NimbleGen and Illumina) performed by four vendors (V1, V2, V3 and V4). (A) Mean number of aligned reads (as million reads), mean read depth and percentage of coverage at 20× for each designed target region as well as mean percentage of on-target reads (i.e. within designed target regions) and mean percentage of off-target reads (i.e. within regions more than ±500 bp outside the designed target regions). Note that values for aligned reads indicate the total number of mapped reads without duplicates for V1 and V2 and only uniquely mapped reads without duplicates for V3 and V4 (Supplementary Table S3). (B) Mean read depth and percentage of coverage at 20× for all and only coding exons of the RefSeq database as well as uniformity of the coverage of RefSeq coding exons calculated as the fraction of exons reaching an average read depth within ±70% of mean read depth over all coding exons (uniformity coding). (C) Mean read depth and percentage of coverage at 15 and 20× for RefSeq coding exons as well as for −50-bp and +20-bp flanking intronic regions. Given are means of all six DNA samples (n = 6); error bars indicate 95% confidence intervals. Values were calculated using the SeqMonk program (http://www.bioinformatics.babraham.ac.uk/projects/seqmonk/) and are presented in Supplementary Tables S4-S8 and S12–S13. For complete coverage of RefSeq coding exons see Figure 3.