
Figure 5.
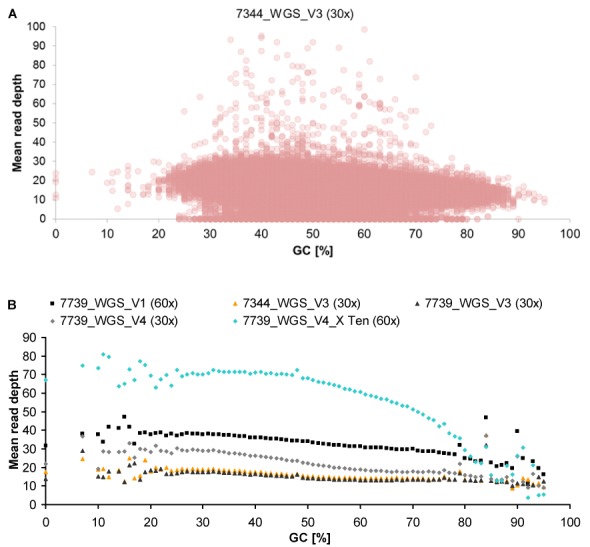
Influence of GC content on mean read depth in WGS. (A) GC content and achieved read depth of RefSeq exons (coding and UTR) exemplified by WGS of sample 7344 performed by V3 (plots of all WGS datasets are shown in Supplementary Figure S17). (B) Means of read depths of RefSeq exons per GC content. X Ten, HiSeq X Ten system.