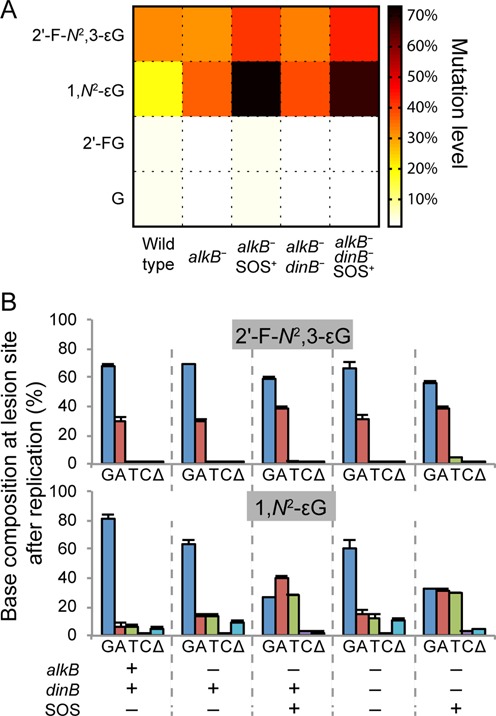
Figure 3.

Lesion mutation frequencies. (A) A heat map representation of the mutation frequencies of 2′-F-N2,3-εG, 1,N2-εG, 2′-FG and G in all five repair/replication backgrounds investigated. (B) Mutation frequency and specificity of 2′-F-N2,3-εG and 1,N2-εG under the five bacterial conditions investigated, with error bars representing one SD (N = 3). G, A, T and C indicate the possible bases present at site N (Figure 1) in progeny genomes (i.e. the base present at the lesion site after in vivo replication), and Δ denotes the occurrence of deletions at the lesion site after replication. Results presented in this figure are also tabulated in Supplementary Table S4.
