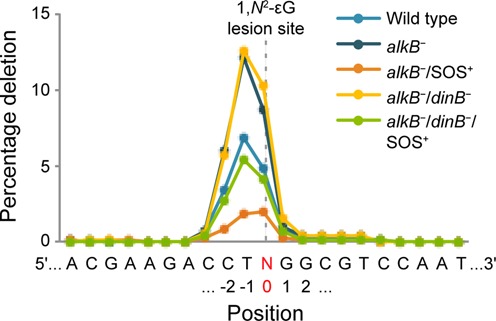
Figure 4.

The frequency of deletions induced by 1,N2-εG at the lesion site and adjacent positions. Each line represents the averaged results from the three independent biological replicates of a specific repair and replication background. N, highlighted in red, denotes the lesion site (position 0).
