
Figure 1.
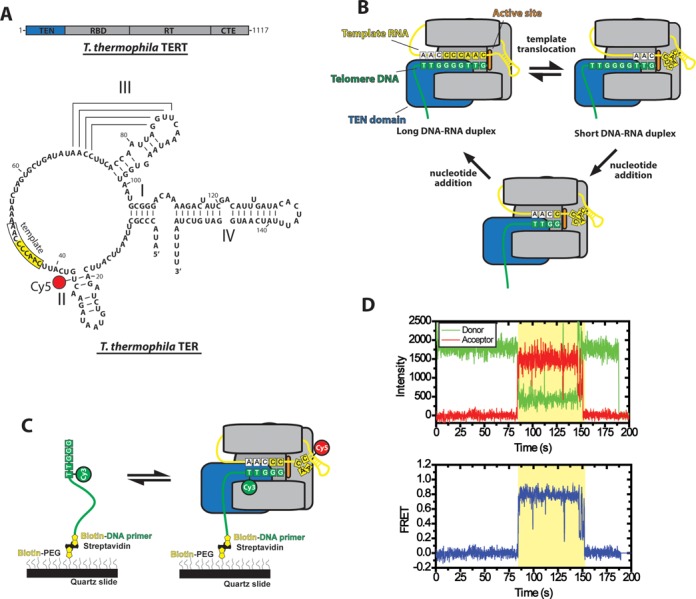
Overview of telomerase smFRET binding assay. (A) Domain organization of Tetrahymena thermophila TERT and secondary structure of Tetrahymena thermophila TER. TERT is divided into the telomerase essential N-terminal domain (TEN, blue), the RNA binding domain (RBD), the reverse transcriptase domain (RT) and the C-terminal extension (CTE). TER contains stems I, II, III and IV as well as a conserved RNA template (boxed region). The position of the Cy5 modification used for smFRET studies at U36 is indicated. (B) Diagram of telomerase catalytic cycle. TERT is represented in gray with the TEN domain highlighted in blue and the active site in orange. The telomeric DNA substrate is represented in green and the telomerase RNA is represented in yellow. The template RNA and telomere DNA form basepairing interactions and this heteroduplex is positioned in a central channel of the enzyme adjacent to the active site (6). When the end of the template is reached, the RNA–DNA duplex is denatured and the RNA template re-anneals downstream to position the template for another round of synthesis (template translocation). The post-translocation state of the enzyme contains a short RNA–DNA duplex which must be stabilized in the active site in order to become extended by the enzyme's reverse transcriptase activity to complete the catalytic cycle. (C) Schematic diagram of smFRET telomerase binding assay. DNA primers containing telomeric DNA sequence are labeled with a donor Cy3 dye at their 5′ most alignment residue and immobilized on a quartz microscope slide by a biotin-streptavidin linkage. Telomerase labeled with Cy5 in its TER subunit is flowed onto the slide and FRET is measured on individual molecules for the duration of the binding events. (D) Example smFRET trace for a (TG)8T2G3 primer incubated with telomerase labeled at the U36 position of the TER subunit. Donor (Cy3) and acceptor (Cy5) intensity are plotted over time (Top panel). The binding event (shaded region) is marked by the onset of a FRET signal, characterized by an anti-correlated drop in donor fluorescence and rise in acceptor fluorescence. Loss of FRET signal at ∼150s occurs either due to Cy5 photobleaching or diffusion of telomerase off of the primer. Loss of Cy3 signal at ∼190s is due to a normal process of Cy3 photobleaching. Donor and acceptor intensity values from the top panel are used to calculate a FRET trace in the bottom panel. The FRET values from each point during the binding event are combined with multiple other binding events to generate smFRET histograms.