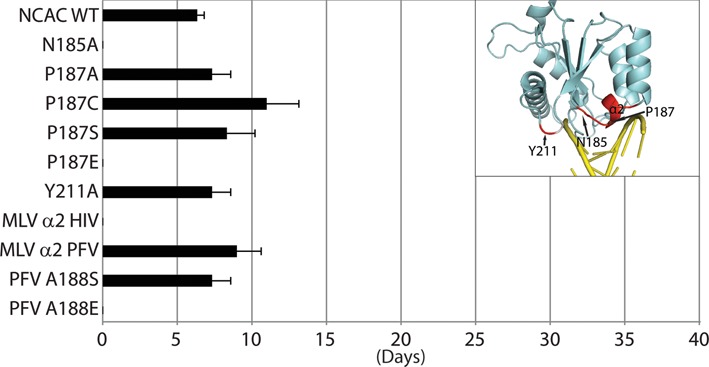
Figure 4.

Replication kinetics of MLV IN CCD mutant viruses. The plot represents viral passage of the IN CCD mutant viruses in D17pJET cells measured by RT activity and scored for the day the culture was RT-positive. Standard error bars are indicated (n = 3). Chi-square test was performed to compare the kinetics of the various mutants with that of NCAC WT. Insert highlights the positions of interest on the structure of IN subdomain.
