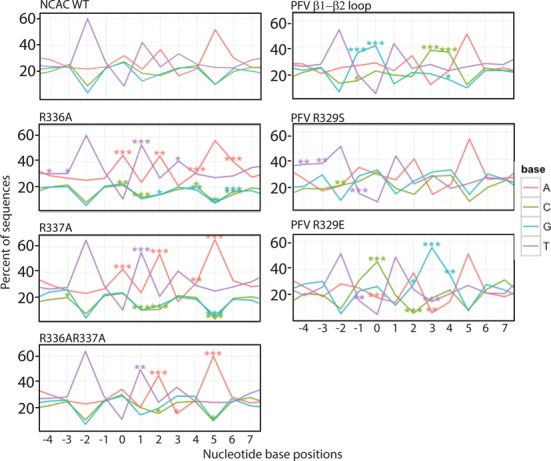
Figure 7.

Sequence LOGOs of MLV IN CTD. Sequence preferences at the site of integration were analyzed using an in-house LOGOs program. Datasets used in the study are listed in Supplementary Table S2. Insert box defines the color associated with each nucleotide. Percent of each nucleotide at each position is indicated relative to the scissile bond at position 0. Statistical significances were compared with the NCAC WT dataset using Fisher's exact test, and P-values were adjusted using Bonferroni correction at the sample level for multiple comparisons (*P < 0.05, **P < 0.01 and ***P < 0.001).
