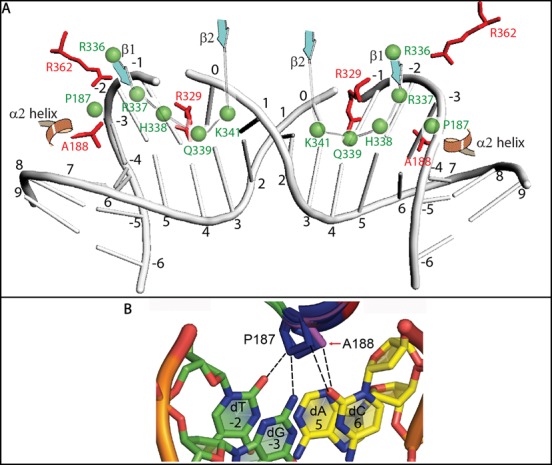
Figure 9.

Model for MLV IN tDNA binding. (A) This model represents the orientation of the MLV IN tDNA binding residues relative to the PFV IN counterparts. The positioning of bent DNA was extrapolated from the PFV IN strand transfer complex (3OS0). Numbers from -6 to 9 indicate the position of nucleotide bases relative to the scissile bond position at 0. Green spheres and green labeling indicates MLV IN amino acids. Red sticks and red labeling indicates PFV IN amino acids. CTD β1and β2 strands and CCD α2 helix are indicated. (B) Magnified view of panel C is shown in order to focus on the potential interactions mediated by P187. -3 (dG), -2 (dT), 5 (dA) and 6 (dC) positions of tDNA are shown. The DNA bases in yellow (5 and 6 positions) are from one strand, while the bases in green (-3 and -2 positions) are from the complementary strand.
