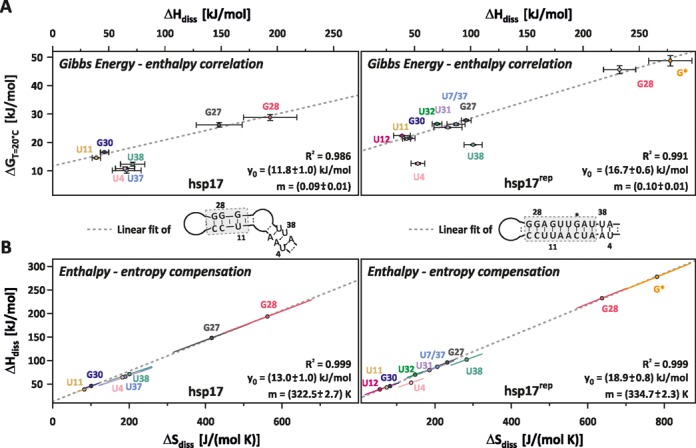
Figure 5.

(A) Gibbs energy–enthalpy correlation and (B) enthalpy–entropy compensation in hsp17 (left) and hsp17rep (right). Correlations of highlighted nucleobases (dashed box) were fitted according to the linear relationship  (dashed line). Error bars in (A) represent the Monte Carlo errors, ellipses in (B) are the confidence ellipses at the one σ-level, which describe the distribution of the ΔH and ΔS pairs obtained from the Monte Carlo simulation. Errors for the linear fit represent standard deviations obtained from linear regression.
