Figure 6.

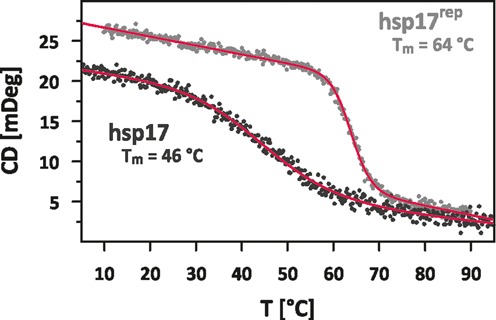
Temperature-induced unfolding curves monitored by CD-spectroscopy of hsp17 (black) and hsp17rep (grey). Parameters of the baseline fit are given in Supplementary Figure S3.

Temperature-induced unfolding curves monitored by CD-spectroscopy of hsp17 (black) and hsp17rep (grey). Parameters of the baseline fit are given in Supplementary Figure S3.