Figure 3.

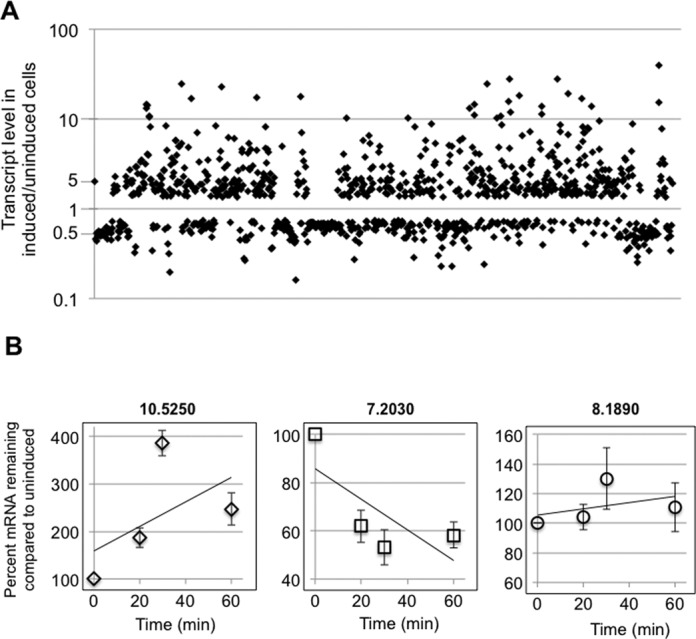
RNAseq analysis of DRBD18 depleted cells reveals extensive changes to the transcriptome. (A) Scatter plot showing transcript abundance (in induced/uninduced DRBD18 RNAi cells) for all transcripts that were significantly affected in biological replicate samples. (B) Degradation kinetics of transcripts that were either up-regulated (10.5250 (Tb927.10.5250, ZC3H32)), down-regulated (7.2030 (Tb927.7.2030, RHS7)), or unchanged (8.1890 (Tb927.8.1890, cytochrome c1)) in RNAseq analyses upon DRBD18 depletion. DRBD18 RNAi cells were either untreated or treated with tetracycline to induce RNAi for 24 h, actinomycin D was added at time zero, and total RNA was isolated at the indicated time points and quantified using qRT-PCR. The quantified results are expressed as the percent of mRNA remaining in RNAi induced cells relative to the amount remaining in uninduced levels. Transcript levels were normalized against mitochondrial 9S rRNA, and are plotted as the average and standard error of 4–6 determinations.
