Figure 8.

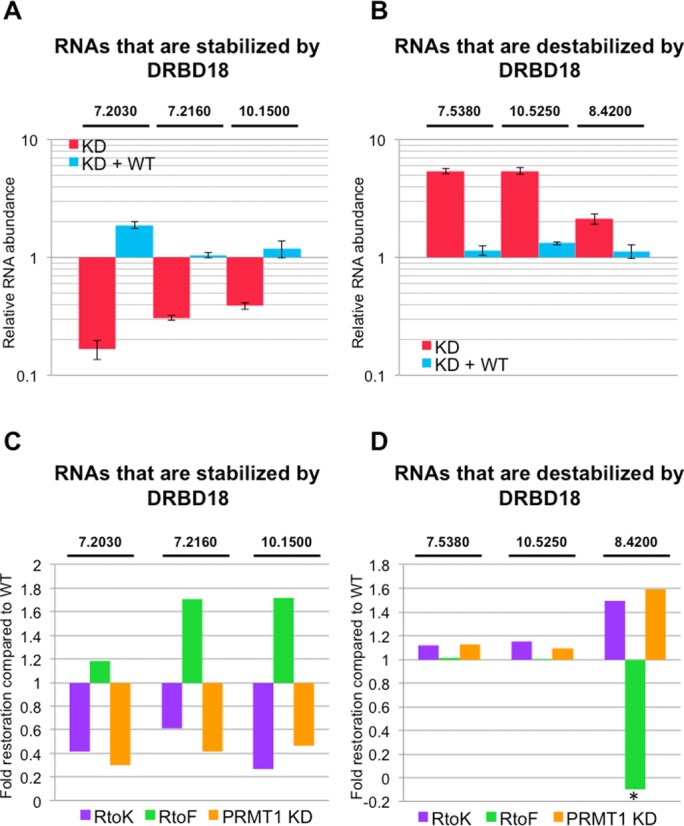
Effects of DRBD18 methylation on target RNA abundances. (A) qRT-PCR analysis of three selected RNAs in DRBD18 repressed cells (KD; red bars) and DRBD18(WT) complemented cells (KD + WT; blue bars). These RNAs were among those whose abundance decreased upon DRBD18 depletion in RNAseq, and are thus normally stabilized by DRBD18. The specific transcripts that were tested are indicated by the last five or six digits of their TriTrypDB number above the graph. RNA abundances were normalized against 18S rRNA and are plotted relative to abundances in uninduced cells. Average and standard deviation from at least three replicates is shown. (B) qRT-PCR analysis as in A, except the three RNAs were among those whose abundance increased upon DRBD18 depletion in RNAseq, and are thus normally destabilized by DRBD18. (C) qRT-PCR analysis of the same transcripts as in panel A in DRBD18(R→K) (purple) or DRBD18(R→F) (green) complemented cells, and in TbPRMT1 knockdown cells (orange). Relative RNA abundances (induced/uninduced) are plotted to show the fold restoration of RNA levels compared that in DRBD(WT) complemented cells. (D) qRT-PCR analysis as in C, except measuring the same transcripts as in panel B. Asterisk, the value is less than one because the transcript level was depleted to a level lower than in the DRBD18 knockdown alone.
