
Figure 1.
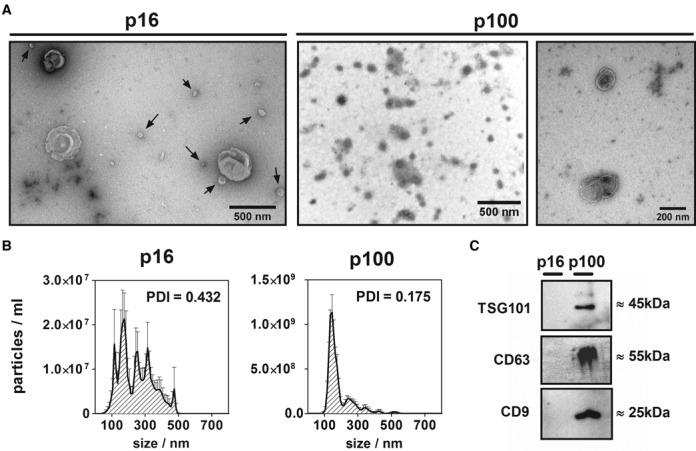
Characterization of p16 and p100 fractions. (A) Negative staining transmission electron microscopy of 16 000 g (p16; left) and 100 000 g (p100; middle: low magnification; right: high magnification) pellets of the conditioned medium of MCF-7 cells. Arrows in p16 show particles of <100 nm which co-purified with bigger (>300 nm) vesicles. (B) Size distribution (nanoparticle tracking analysis) of p16 (left) and p100 (right) fractions. Error bars correspond to the standard error of the mean for five repeated measurements of the same sample. The polydispersity index (PDI) of replicates of the same fractions measured by dynamic light scattering is also shown. (C) Western blot of exosomal markers: TSG101, CD63 and CD9 in equal protein loads of MCF-7 p16 and p100 fractions.