
Figure 2.
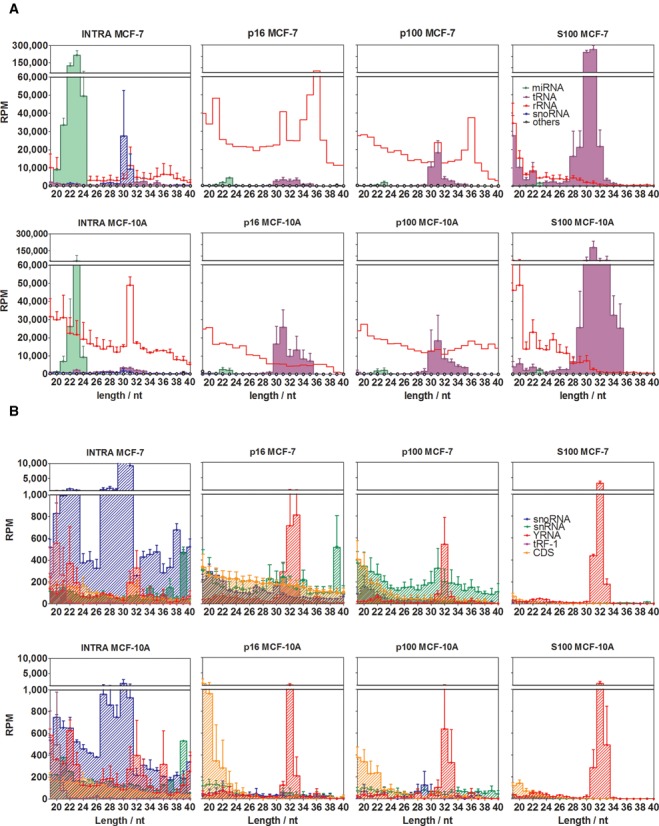
Different small RNA profiles characterize intracellular and extracellular fractions. Reads were annotated in one of the following functional categories: miRNAs (green area), rRNA-derived sequences (red line), snoRNA-derived sequences (blue diagonal pattern), tRNA-derived sequences (violet area), snRNA-derived sequences (green diagonal pattern), sequences derived from protein-coding exons (orange diagonal pattern), YRNA-derived sequences (diagonal red pattern) and 3′ trailer sequences from tRNA precursors (violet diagonal pattern). (A) and (B) are plots of the same data, but miRNAs, rRNA-derived and tRNA-derived sequences were omitted in (b) for reasons of scale. RPM: reads per million mapped reads. Error bars correspond to one standard error of the mean (n = 3 in p16, p100 and S100; n = 2 in INTRA), and were omitted for rRNA-derived sequences in p16 and p100 for reasons of clarity. The upper size limit of the graphs was set to 40 nt since no remarkable small RNA populations were detected beyond that size.