
Figure 2.
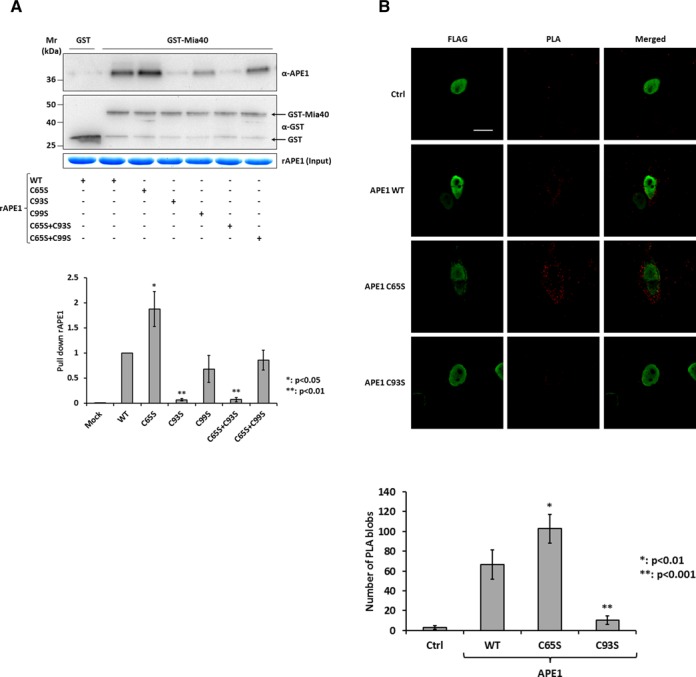
APE1 interacts with Mia40 through the redox Cys93 residue. (A) Western blot (top) and relative histogram (bottom) of GST pull-down analysis of recombinant APE1 (15 pmoles) WT and redox Cys65, Cys93, Cys99, Cys65+Cys93 and Cys65+Cys99 to Ser mutants. GST-Mia40 (15 pmoles) was used as prey and GST (15 pmoles) alone as control. The binding of APE1 WT and mutants was normalized to the western blotting signal of GST-Mia40. (B) Representative immunofluorescence images (top) and histogram (bottom) of PLA analysis between ectopic flagged APE1 and endogenous Mia40. HeLa cells were transiently transfected with pCMV5.1-FLAG vector expressing APE1 WT, Cys65 and Cys93 to Ser mutants. APE1 expression was detected by using an anti-FLAG antibody (green), while PLA signal are visible as red dots. Control reaction was carried out omitting anti-Mia40 antibody and shows no or little PLA signal. White bar corresponded to 10 μm. Data reported in the histogram accounted for the average number of PLA signals of at least 15 randomly selected cells per condition.