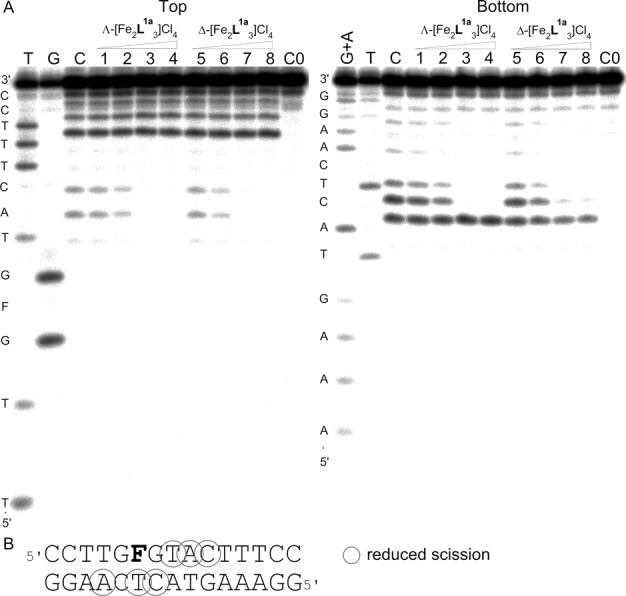
Figure 6.

(A) Autoradiograms of DNase I footprint of 5’ end labelled top (left) or bottom (right) strand of the GFG/CTC duplex containing an AP site in the presence of increasing concentrations of Λ-[Fe2L1a3]Cl4 (lanes 1–4) and Δ-[Fe2L1a3]Cl4 (lanes 5–8). Lane C; GFG/CTC duplex in the absence of flexicates. Lanes 1–4; GFG/CTC duplex mixed with Λ-[Fe2L1a3]Cl4 at 0.5:1, 1:1, 2:1 and 3:1 (flexicate:DNA duplex) ratios, respectively. Lanes 5–8; DNA duplex mixed with Δ-[Fe2L1a3]Cl4 at 0.5:1, 1:1, 2:1 and 3:1 (flexicate:DNA duplex) ratios, respectively. Lane C0; DNA duplex in the absence of flexicates and DNase I. Lanes T, G and G + A correspond to T, G and G + A ladders. The nucleotide sequence of the oligonucleotide is shown on the left side of the gels. (B) Sequence of the DNA duplex containing an AP site indicated by letter ‘F’ showing sites (shown by circles) protected by Λ- and Δ-[Fe2L1a3]Cl4 from the cleavage by DNase I.
