
Figure 4.
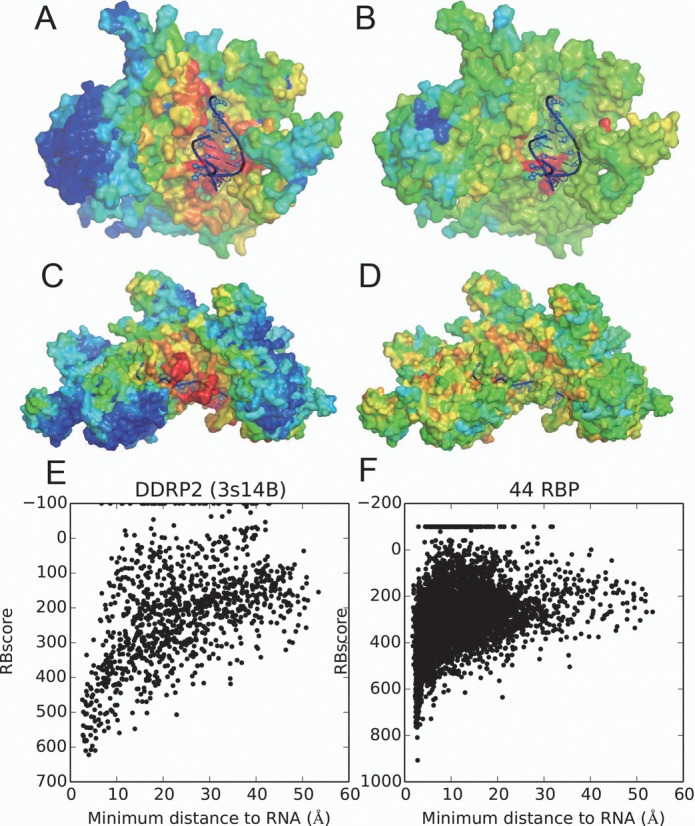
Energy funnel comparison on protein surface. (A) RBscore mapped on DNA-directed RNA polymerase II (DDRP2) subunit RPB2, PDB id 3S14 chain B (not in the training set) with rainbow color. (B) SVM score mapped on DDRP2 protein in the same way. (C) RBscore mapped on DBP recA, PDB id 3cmw chain A (not in the training set) with rainbow color. (D) SVM score mapped on recA protein in the same way. (E) The relation between distance to RNA and RBscore clearly shows an energy funnel-like pattern of DDRP2 protein. (F) A distribution between distance to RNA and RBscore on 44 RBP.