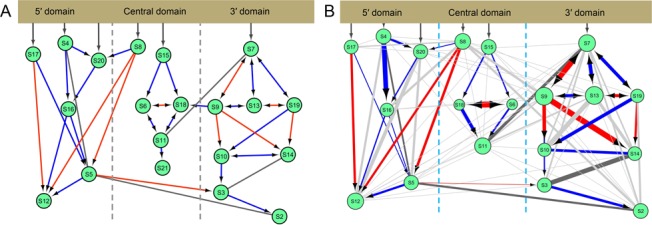
Figure 1.

The Nomura Assembly Map. (A) The modified Nomura Assembly Map: 16S rRNA shown at the top, proteins are shown as green circles. Each line connecting two proteins indicates a directional cooperative relationship (the protein at the bottom depends on the pre-binding of the protein at the top); red arrows indicate simultaneous presence of physical interaction and kinetic cooperativity; blue arrows signify only kinetic cooperativity and black lines signify only physical interaction. The S19–S10 kinetic cooperativity refers to the prebinding experiments of ref. (25). (B) The edge-weighted inter-protein co-evolutionary network is projected onto the modified Nomura Assembly Map. Proteins are shown as green circles, circle size is proportional to the number of other proteins it co-evolves with. S21 is not shown (not analyzed as it is not universal in bacterial superkingdom). Gray colored edges represent the presence of co-evolutionary relationships that are not associated with direct biophysical constraints (some gray edges are associated with indirect cooperative relationships). Thickness of the lines connecting two proteins is proportional to PS.
