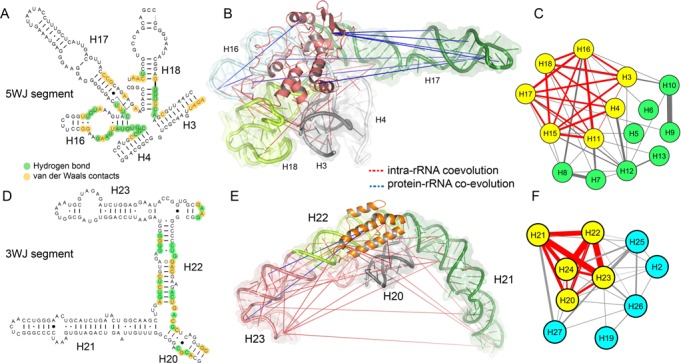
Figure 3.

Co-evolutionary patterns at 5WJ and 3WJ rearrangement sites. (A) The native molecular contacts (green: H-bonds, yellow: van der Waals contacts) between S4 and 5WJ region of the 16S rRNA are highlighted. (B) The protein–rRNA and intra-rRNA co-evolutionary patterns at the 5WJ segment are shown (RNA: cartoon plus surface, S4: salmon cartoon). Each helix in the 5WJ segment is highlighted. (C) The inter-helix co-evolutionary network of 5′ domain is shown; each node represents one rRNA helix, while edge thickness is proportional to co-evolutionary preference scores. The 5WJ helices cluster as a dense-weighted module (yellow nodes, red edges). (D) Native molecular contacts between S15 and 3WJ region (green: H-bonds, yellow: van der Waals contacts) of the 16S rRNA. (E) The intra-rRNA co-evolutionary pattern at the 3WJ segment (RNA: cartoon plus surface, S15: orange cartoon). Each helix in the 3WJ segment is highlighted. (F) The inter-helix co-evolutionary network of central domain is shown; the 3WJ helices cluster as a dense-weighted module.
