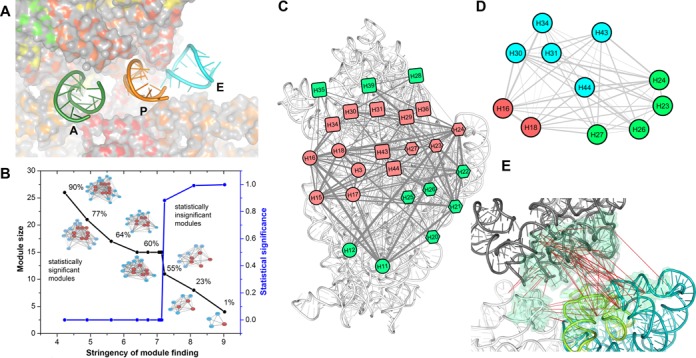
Figure 4.

Co-evolutionary pattern at the APE-neighboring region of the 16S rRNA. (A) The tRNA movement tunnel: the A, P and E site tRNAs are shown as cartoon view (nt 28–40 segments of their anticodon arms), while 16S rRNA is shown as a colored surface. The tRNA-movement tunnel is highlighted by gradually increasing the surface transparency with surface depth. (B) The modules found (as computational stringency to finding a module is gradually reduced) within the inter-helix edge-weighted co-evolutionary network of 16S rRNA; black curve shows growth of module size, while blue curve indicates statistical significance of the module. Reduction of stringency is presented in a linear scale. Salmon colored nodes signify APE-neighboring helices. The percentages indicate how many known 16S rRNA point mutation sites reside within the module-helices. (C) The module including 90% of all reported mutation sites is projected onto the 16S rRNA (white cartoon). (D) The co-evolution among the APE-neighboring helices is shown. Helices from each domain are colored differently: red (5′ domain), green (central domain) and cyan (3′ domain). (E) The CEPs at the APE-neighboring region are shown. Many CEPs are identified between central and 3′-domain. The H44 of 3′-minor domain (green cartoon) exhibits several CEPs with its neighboring central domain and 3′-major domain nucleotides.
