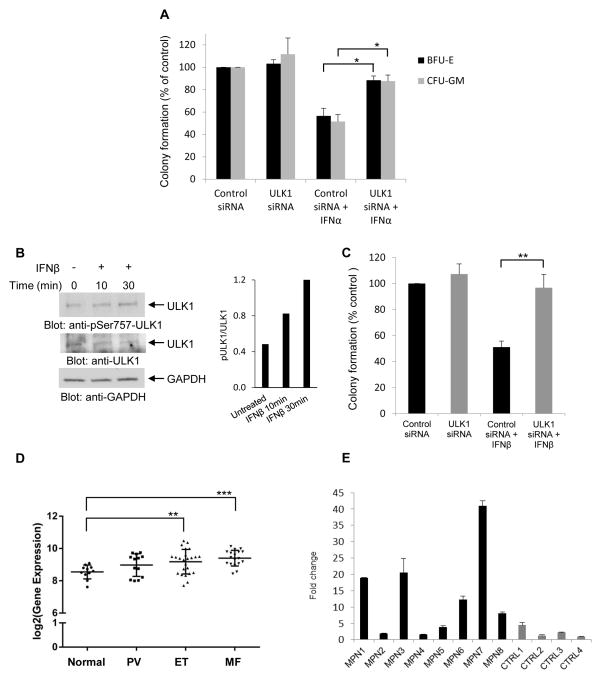
Figure 7. Requirement of ULK1 for the regulatory effects of Type I IFNs on normal and malignant human hematopoiesis.
(A) Normal human bone marrow-derived CD34+ cells were transfected with either control siRNA or ULK1 siRNA, and then incubated in clonogenic assays in methylcellulose in the presence or absence of human IFNα, and myeloid (CFU-GM) and erythroid (BFU-E) progenitor colony formation were assessed. Data are expressed as percent colony formation of control siRNA-transfected untreated cells, and represent means ± SE of three independent experiments. Statistical analysis was performed using Student’s t-test (*p < 0.05). (B) (Left panel) Serum-starved circulating primary peripheral blood mononuclear cells from a patient with PV were treated with human IFNβ for 10 or 30 minutes, as indicated. Total cell lysates were resolved by SDS-PAGE and consecutively immunoblotted with p-S757 ULK1 and ULK1 antibodies. The immunoblot was also probed for GAPDH as a loading control. (Right panel) Bands were quantified by densitometry using ImageJ software, and data are expressed as ratios of p-ULK1/ULK1. (C) Peripheral blood mononuclear cells from patients with PV were transfected with either control siRNA or ULK1 siRNA and the effects of human IFNβ on malignant erythroid (BFU-E) colony formation were assessed by clonogenic assays in methylcellulose. Data are expressed as percent colony formation of control siRNA-transfected untreated cells, and represent means ± SE of five independent experiments, using cells from 5 different patients with Polycythemia Vera. (D) Box plot shows gene expression of ULK1 in neutrophils in a large independent cohort of normal individuals (normal, n = 11), and patients with PV (n = 13), ET (n = 24), and MF (n = 18). Statistical analyses were performed using Student’s t-test comparing expression in each MPN group to the normal group (**p < 0.01; ***p < 0.001). (E) Quantitative RT-PCR analysis for ULK1 mRNA expression in neutrophils isolated from different patients with MPNs (MPN1-8) and age-matched controls (CTRL1-4). Expression levels of the ULK1 gene was determined using GAPDH for normalization. Data are expressed as fold change over CTRL4 and bar graphs represent means ± SD for two independent assays.

